Why do Chelsea struggle so much without Reece James?
Why do Chelsea struggle so much without Reece James?
Attempt to quantify Reece James' impact when playing for Chelsea

It was pleasing to see Reece James back in the starting lineup and get 60’ against Fulham on Friday evening after a setback, back in December, in his recovery from the pre World Cup knee injury. This was followed by a strong outing where he played the full 90’ away at West Ham. We need not rely on data to understand the impact Reece James has when starting a Premier League match for Chelsea. Though given that’s what this article is about, let’s take a look at some of the key statistics with the aim of objectively quantifying his impact on the way Chelsea play with and without him as well as the outcomes of the matches.
In the league this season, with Reece starting 8 games, Chelsea have a pretty solid record where they have won 5 (63%), drawn 2 (25%) and lost 1 (13%). Without Reece, Chelsea have almost often struggled be it under Tuchel or Potter. Out of the 13 games, they have won only 3 (23%), drawn 4 (31%) and lost 6 (46%). In conclusion, whatever promising results Chelsea have managed to achieve this season almost all of them have coincided with Reece James’ being in the starting XI.

Points per game benchmark
First we look at the most direct metric in terms of points per game earned in the league this season for Chelsea players. There have been attempts to quantify a player’s impact on the final outcome of a match using +/- models.
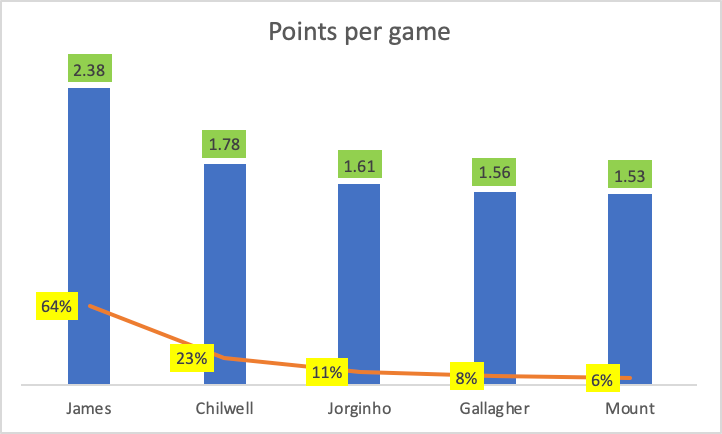
Looking at the numbers from this season (players having played more than 500 minutes), Chelsea have a 3x more chance of bettering the expected points when Reece James starts.
Reece James is averaging 2.38 points per game this season. The next best player is Ben Chilwell at 1.78. This goes to show how badly Chelsea have missed their wingbacks in recent weeks and months.
It is worth noting that the now departed Jorginho, Gallagher and Mount all have a better than average (1.45) points per game this season.
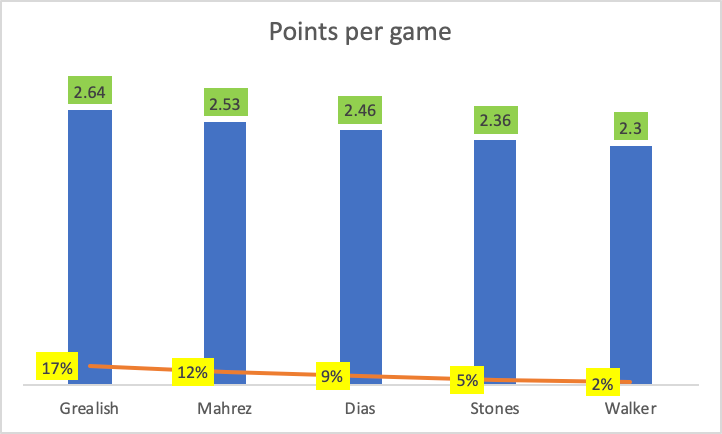
Points per game, on its own as a metric doesn’t add much insight and hence we put the above numbers into context by benchmarking against Manchester City’s. City and Chelsea have at least one indifferent thing this season - the unpredictability of the starting lineup and the constant rotation of players.
Reece’s 2.38 points per game betters City’s average of 2.25 and goes to show the value-add to even one of the most consistent team in the league. Another contrasting thing we notice is how usually strikers and attacking players can positively influence the outcome of matches compared to defenders and keepers - well you need to score to win matches. Let’s park this debate for now keeping in mind Chelsea’s leading pairing of injured wing-backs are comparable to Grealish and Mahrez who are having an exceptional season for City.
Offensive metrics comparison
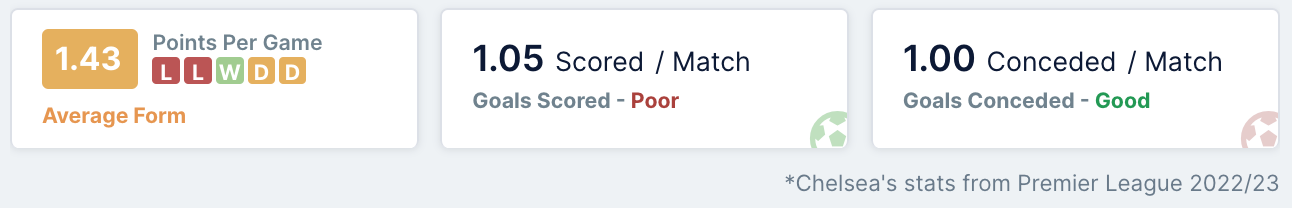
Chelsea have scored about a goal per game (1.05 to be precise), despite outperforming their average xG of 1.57, this season indicating clearly their struggles as an attacking unit. Going one level further, they have averaged 12.81 shots per match with only 4.95 out of those on target. In terms of recent form, Chelsea have scored 3 goals in their last 5 premier league matches and 6 in 10 suggesting the trend has carried on for quite some time either side of the World Cup.
Zooming in on at a player level again let’s take a look at the comparison between James and Azpilicueta, who has played the most minutes at RB ever since James’ injury. We can see a clear daylight between the two in terms of their impact going forward.
As seen below in the Understat player radar, James is averaging 1.32 shots per 90 minutes with a xG of 0.11 which is 10% and 7% respectively of the team level stats reported above.
As for his passing and chance creation contributions he has made 1.32 key passes and 0.23 expected assists per 90 minutes which are again eclipsing Azpilicueta’s corresponding numbers.
Metrics for transitional play value (build-up play, xG chain) also suggest small but significant superiority where James provides a better throughput in terms of build-up play and transitions.

Positional impact comparison
Next, we look at the event’s data from Twelve football to compare and contrast the positional impact between James and Azpilicueta. Here we break it down in terms of attacking output and defensive impact across different areas specifically on the right flank..
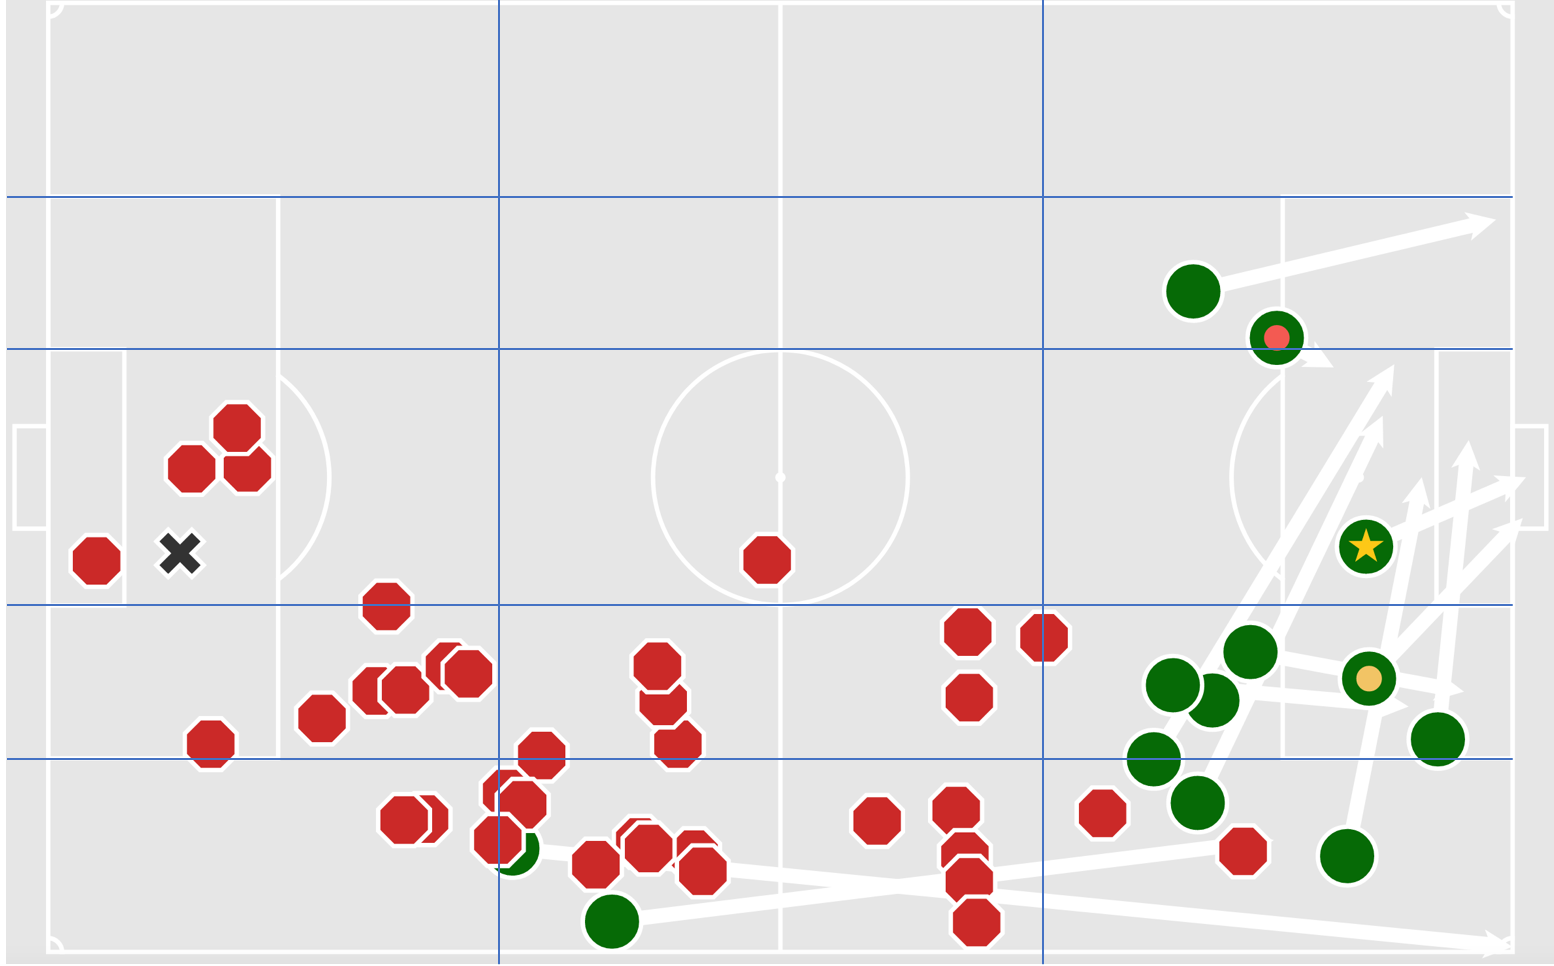
Expected threat (xT) is a metric used to quantify on-ball player actions calibrated to give a the probability of the actions leading to the team scoring. Each pass, carry, dribble and cross is attributed a xT value for the respective player completing a successful action. Looking at the plots below, James is way more active going forward in the right half space with higher xT value passes and crosses into the box. James has 2 shots (1 goal) and 7 high value passes and crosses compared to Azpilicueta’s 3 crosses.
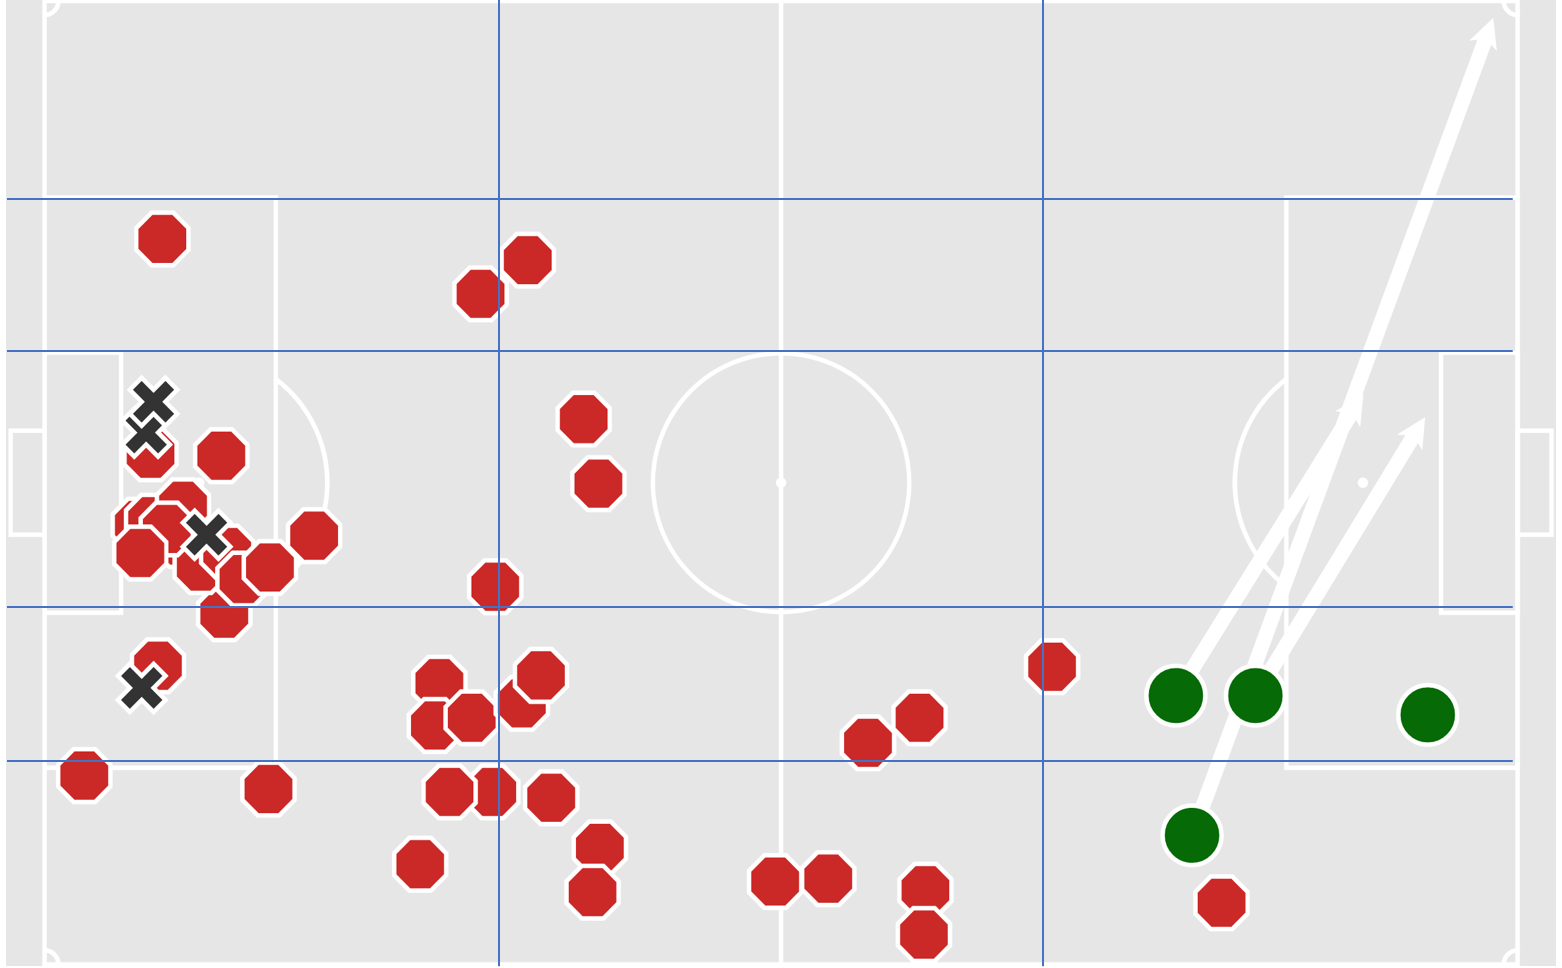
In terms of Defensive impact, again James can be clearly seen to engage in more defensive duels in the middle 3rd compared to Azpilicueta who seems to be more conservative in engaging with opposition forwards. It is worth noting that Azpilicueta has also spent some minutes playing at RCB in a back three defence. Despite of that, James provides a more aggressive option where he’s shutting down opposition attacks much higher up the pitch on average.
League counterparts benchmark
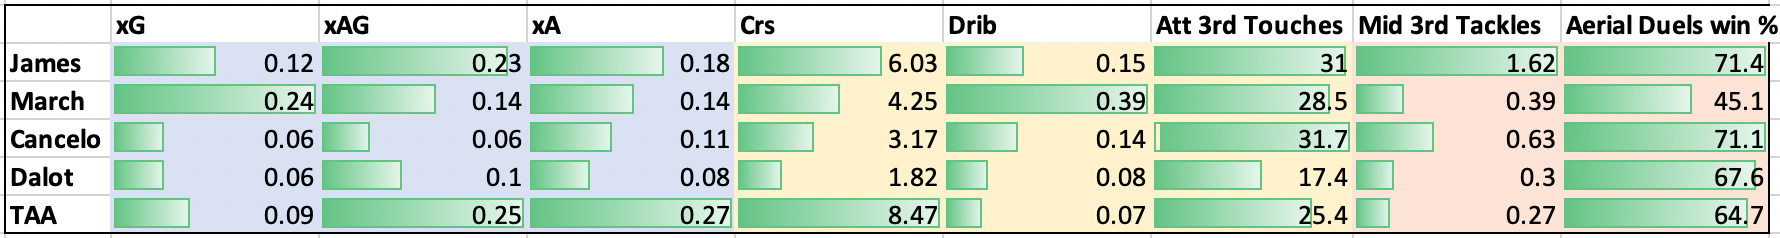
Lastly, I looked at the FBref scouting report for Reece James. It gives out a list of similar players playing at RB/RWB in the premier league. I narrowed down that list to keep players who play for the top half teams to naturally account for higher possession. That leaves us to compare James with March (Brighton), Cancelo (Man City), Dalot (Man United) and Alexander-Arnold (Liverpool). There are quite a few metrics that we can look at though I have selected the below owing to the typical responsibilities expected from a fullback/wingback role in modern football. All metrics have been normalized for values per 90 minutes.
Attacking intensity - In terms of Dribbles and Crosses completed, James stands out in both departments. Only March has more dribbles and Alexander-Arnold has more crosses per 90 minutes than James in the league so far. He is second behind Cancelo for attacking 3rd touches showing his flair and adventurous mentality when it comes to carrying the ball forward.
Attacking output - Having proven his superiority for attacking quantity we next look at qualitative measures in Expected Goals (xG), Expected Assisted Goals (xAG) and Expected Assists (xA). Once again James is making his dribbles counts with high xAG and xA numbers bettered only by Alexander-Arnold and getting into good scoring positions with his dribbles where his 0.12 xG per 90 is the second best in the league.
Defensive impact - Couple of interesting metrics from a defensive impact point of view are Middle 3rd Tackles and Aerial Duels Won. James has completed 1.62 middle third tackles per 90 which is comfortably higher than the other four players in comparison. This validates our earlier hypothesis of James’ effectiveness in winning the ball higher up the pitch. James also has the highest Aerial Duels win % winning just over 71% of the aerial duels contested.