

Tottenham get battered and Betting strategies deep-dive
Tottenham get battered and Betting strategies deep-dive
Blues make it 3/3 in a trilogy of London derbies and this week we take a deeper look at some of the betting strategies recommended by David Sumpter

Credits: WhoScored.com, soccerapi, 888Sport, David Sumpter, Euro Club Index, FiveThirtyEight, Squawka, Mick Cooney, Dublin Data Science, Ted Knutson, Tifo Football
Contents:
Match of the week: After a short break, we are back analyzing another tactical battle between Tuchel and Conte. I was at the Bridge last weekend watching the action live as it unfolded including that worldie from Ziyech!
Reading updates: We do a deep-dive into the calculations for the recommended betting strategies from David Sumpter’s Soccermatics.
Self-learning Progress: Updates of changes pushed to the GitHub repo and meetup.com mini-series teaching the basics of Bayesian Inference.
Community Briefing: Get to know more about the pioneers in the field and the usual extract of social media roundup from the last while captured in this section.
1 Match of the week
PL: CHE v TOT | Date: 23/01/2022
Formation: 4-1-4-1/4-1-2-3 | Result: 2-0
This week I’ve decided to dig into some of the visualizations created by WhoScored.com on their dedicated Match Centre page for this particular match. It’s one of the many portals out their providing such forums for fans to interact and engage with live match events during and after the match. I will aim to provide reference for more such platforms over the coming weeks and eventually the plan is to produce these visualizations with some Python/R magic.
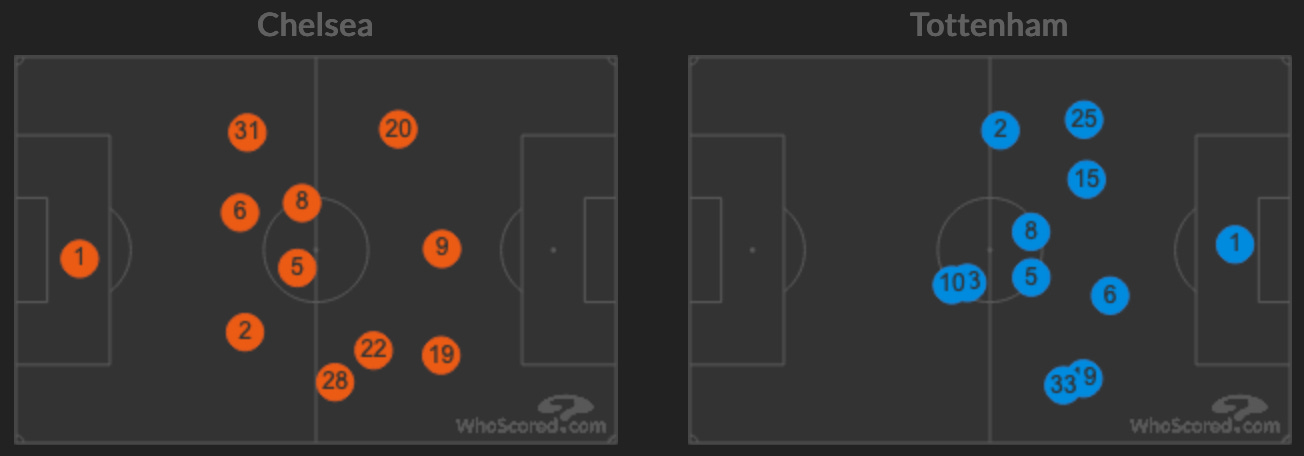
First up let’s look at the Average Positions Map of both teams. Ironically enough Orange dots are Chelsea and Blue are Tottenham. The flexibility in Chelsea’s smooth transitioning from a back four (in possession) into a back five (without the ball) is quite evident here.
(22) Ziyech and (19) Mount were so good with their interplay that it almost forced (28) Azpilicueta to get on his bike to provide more width and options on the right flank. What is also clear by looking at the plot below is the fact that Mount was the more progressive and more wider with his runs in behind of the two attacking players on this side whereas Ziyech was happy to do his usual stuff where he’d cut inside on his dominant left and either cross across the goal or have a go on goal himself (*trying my best to not mention anything about that goal yet*).
On the opposite flank, (31) Sarr was much more conservative and understandably so given his predominantly central roles historically. That wasn’t necessarily a problem for (20) Callum Hudson-Odoi who weaved his dribbling magic making the most of free space thanks to overloads on the other flank.
Just couple of pointers looking at the Blue Spurs’ dots:
In general, these dots appear to be pegged back into their own half and lacking any real shape or structure. They were more reactive to what Chelsea were throwing at them (and trying to nullify that) rather than any real game plans of their own to get forward. All of their big chances came on the break forced by Chelsea mistakes.
They started (or at least appeared to start) with a back four but with the overloads and the fast interplays Chelsea were displaying on the right flank meant (19) Sessegnon had to support (33) Davies to avoid such situations. That meant Spurs started operating as a back five as visible from the positions below.
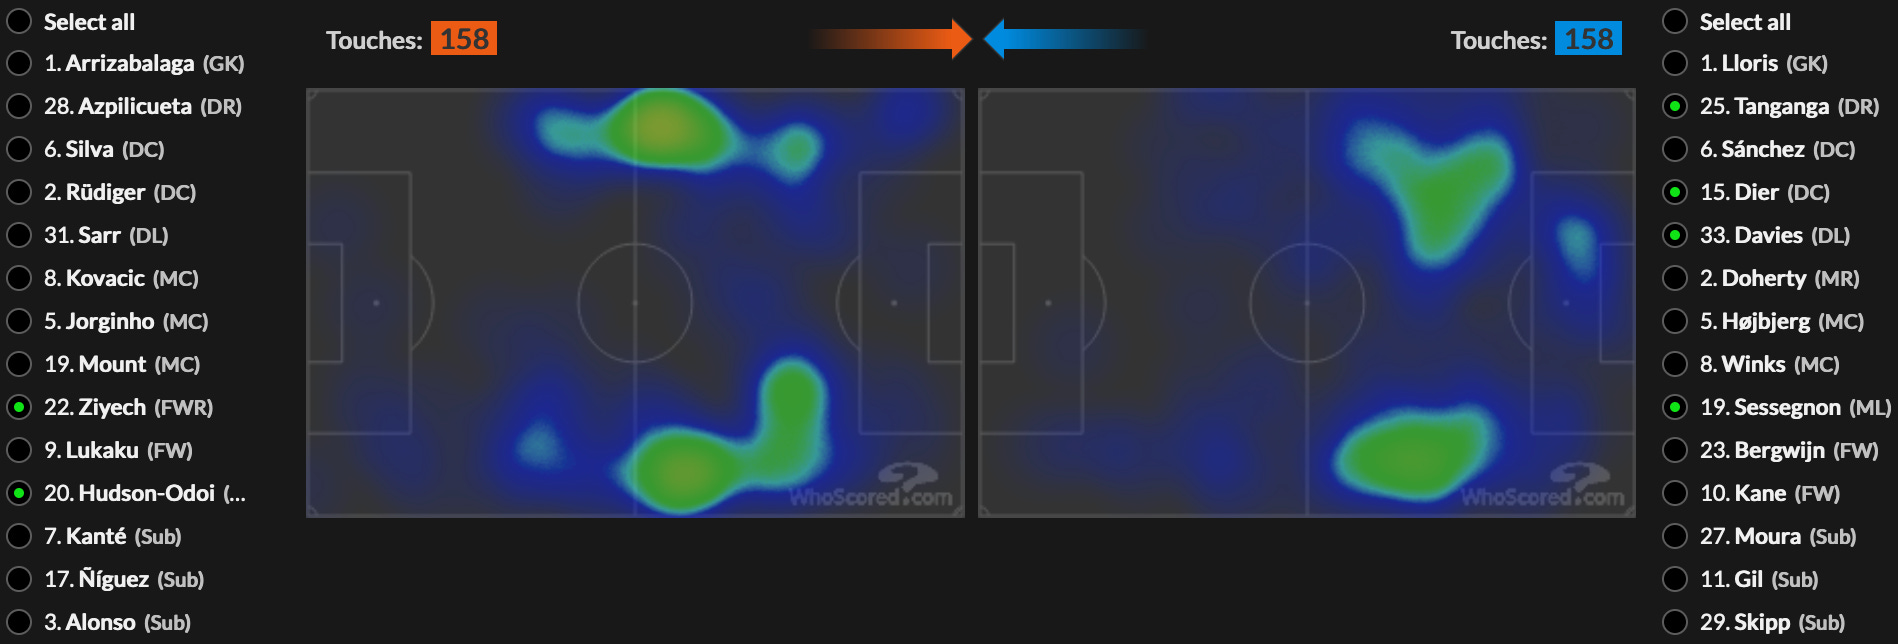
Next up, we look at the Heatmaps of a select choice of players from both sides. Both of Chelsea’s goals were created from ball being progressed swiftly from the wings.
The focus is on the two Chelsea wingers (CHO down the left and Ziyech on the right). As discussed above, Spurs had to defend in pairs with the hope to sustain the momentum building up in Chelsea’s attacks from the wings. Coincidentally (Ziyech+CHO) had 158 touches most of which were inside Spurs’ half and so did the combined pairs [(Tanganga+Dier) + (Davies+Sessegnon)] again in their own half had exactly the same number of touches.
While the (Tanganga+Dier) pairing did well to defend the left half-spaces, there was way too much room for CHO on the left wing as seen below. The move for Chelsea’s first goal started from this wing with CHO dribbling from the halfway line and swiftly changing wings to claim the assist for Ziyech’s goal. Again, it was CHO being fouled on the same wing which led to the Mount free-kick for Chelsea’s second.
Looking on the other wing now, at Ziyech against the pairing of (Davies+Sessegnon), frequent overlapping runs from Mount and/or Azpilicueta (as analyzed in this article by Michael Cox) gave Ziyech the freedom to drift inside into the dangerous half spaces and inflict damage as he did with that wondrous strike.
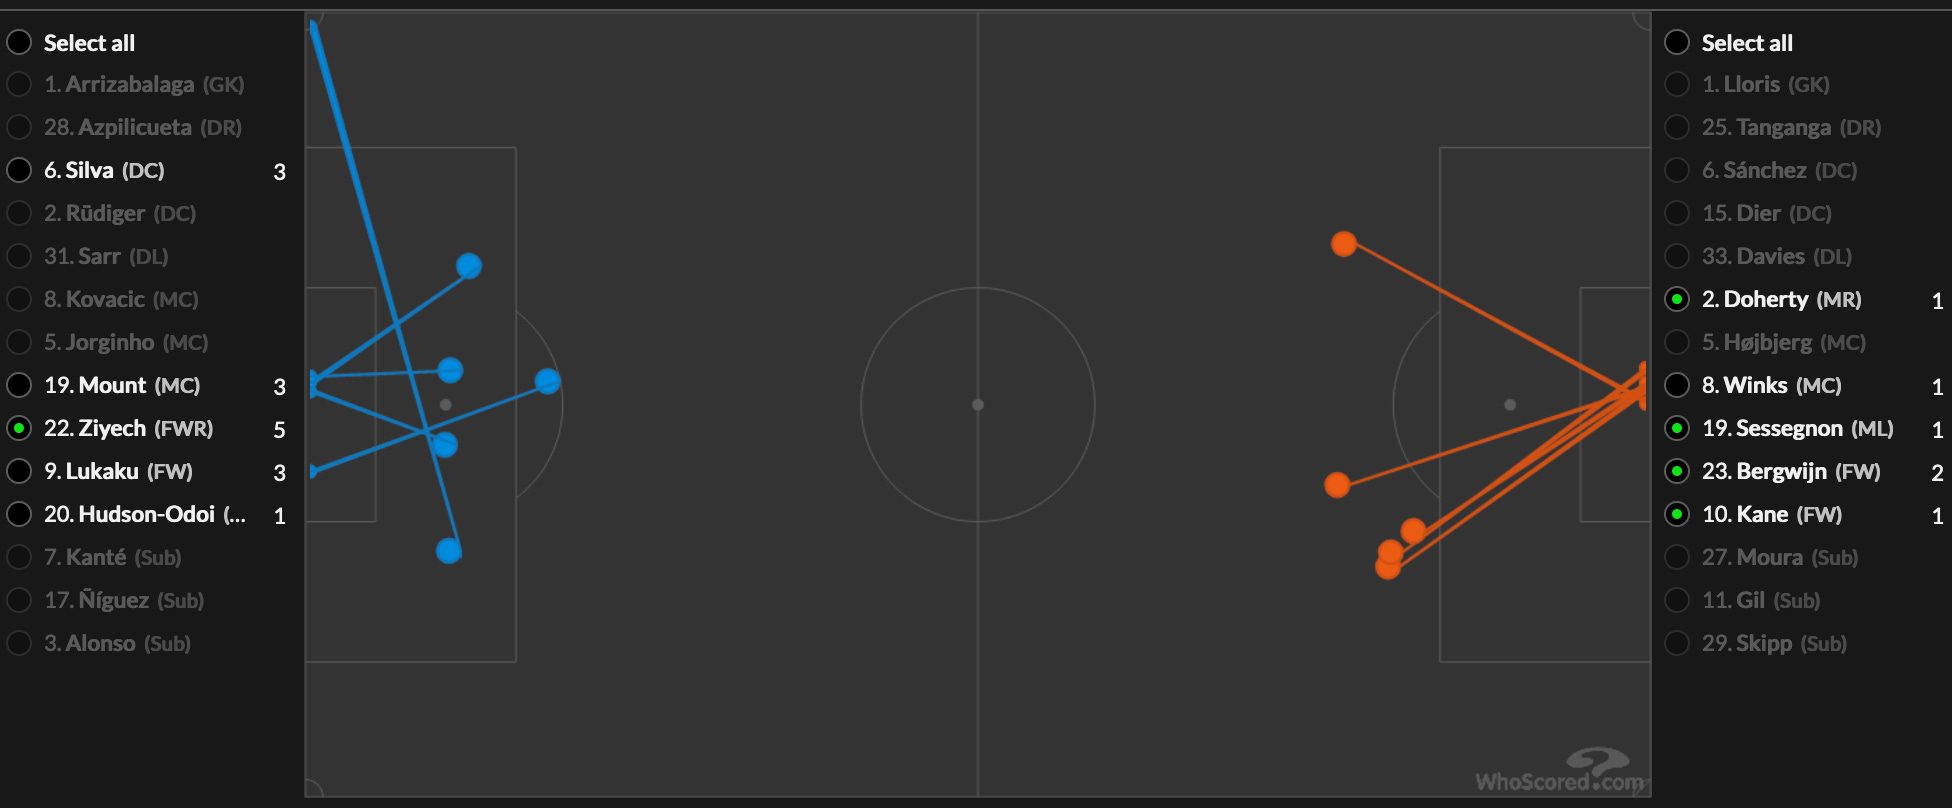
Lastly, there was an interesting observation regarding the shooting efforts from either side and the xG figures for the same. As seen in the Shot Map below, this gives us a shooting comparison with Ziyech who had the most (5) shots in the match on one side against the 5 best shooting opportunities for Spurs consisting of two efforts from Bergwijn and one each from Kane, Sessegnon and Doherty.
What’s surprising to note here is all five of Ziyech’s attempts (Orange, right) were from outside the box with a combined xG of 0.13 meaning a chance of 1 in almost 8 shots from similar chances (on an average) would go in. So he’s done well in that regards to convert from the 5 attempts he had and to credit the shot that resulted in the goal - it had a xG value of 0.02 suggesting that 1 in 50 shots from a similar position and in-game situation to go in. It was indeed an exceptional strike!
At the other end, and now looking at the Spurs’ combined efforts (Blue, left), 4/5 shots were from inside the box and relatively way better shooting positions. They had a combined xG of 0.29 with Bergwijn’s two shots alone accounting for 0.15 xG. This goes to show either how wasteful or seemingly unlucky Spurs were in converting their chances or how good Chelsea were in preventing these chances from leading to a goal - and in my opinion it was a mix of both!
2 Reading updates
Continuing on from the discussion about betting strategies, I finally completed the code for evaluating the recommended (by David Sumpter) strategies. First things first, I used a Python scraper API (soccerapi) for fetching the live odds for the upcoming Premier League matches from a popular online betting portal 888sport. Please find below the sample script to do the same.
from soccerapi.api import Api888Sport
# from soccerapi.api import ApiUnibet
# from soccerapi.api import ApiBet365

api = Api888Sport()
url = 'https://www.888sport.com/#/filter/football/italy/serie_a'
odds = api.odds(url)

print(odds)
In each of the below 4 strategies, we calculate the expected probabilities of either team winning or a draw and then do a simple final assessment where we check if (p > 1/o) for
where ‘p’ is the calculated expected probability for a win/draw and ‘o’ is the European (decimal) bookmaker’s odds.Strategy 1: Odds-bias strategy
Here, David talks about how the bookmaker’s odds sometimes underestimate the true probabilities of winning when there’s a strong favourite predicted to win (e.g. Man City vs Brentford in the upcoming GW) or probabilities of drawing when the two teams are evenly matched (e.g. Newcastle vs Everton again from the upcoming GW). There are hard-coded assumptions 1 made here as per the coefficients for the models used by David to support his own hypotheses. You can find the entire Jupyter notebook for the script I have used to simulate these bets here: SoccerAPI.ipynb.
As you can see from the results outputted by the script below 5 bets are recommended in the next two gameweeks as per this strategy to “potentially” turn out profitable. It would be interesting to compare the “what-if potential” of these bets when we have the actual results for these matches.Newcastle and Everton to draw at St James’ Park
(Current pre-match odds for a draw at 3.35)Brentford and Crystal Palace to play out a draw
(Current pre-match odds for a draw at 3.05)Everton and Leeds United to end up level at Goodison
(Current pre-match odds for a draw at 3.7)Newcastle and Aston Villa to draw
(Current pre-match odds for a draw at 3.45)Leicester City to draw at home against West Ham
(Current pre-match odds for a draw at 3.5)
Strategy 2: Ranking indexes
The next strategy suggests that we take a look at the online ranking indexes that rank clubs and predict odds for each team to win/draw/lose. The two indexes I chose as part of this experiment were the Euro Club Index and the FiveThirtyEight. We get the “predicted probabilities” directly from these websites and I haven’t yet come across a scraper for these websites yet and hence done the calculations in Excel which you can find here - BettingSheet.Strategies 3 & 4: Performance indicators & Expert predictions
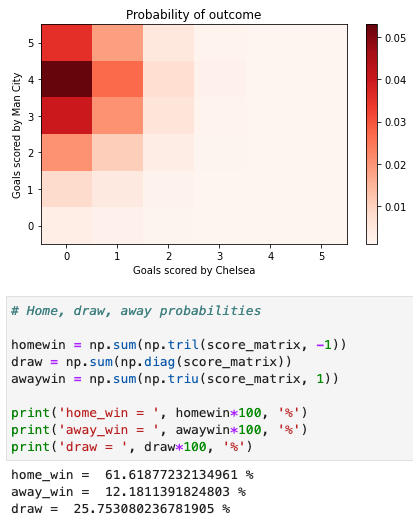
Both these strategies rely on the use of expected goals for both teams feeding into a Poisson Simulation model similar to one used in this notebook. The output of this simulator run over multiple iterations can be converted into probabilities for each of the three possible outcomes as shown in the image below. The Performance indicators based strategy calculates the expected home and away goals to be scored in each match based on the following four factors:r = completed passes per minute by the home team
h = xG (expected goals) per 90 for the home team
g = xGA (expected goals against) per 90 for the home team
b = flag indicating whether the away team is a top six club
The expected goals for each team is calculated based on a logistic regression model trained on historical data from past matches and results. The coefficients as determined by this model2 are then used to give us the expected goals.
Number of home goals = e^((-0.75 + 0.13 ∗ r + 0.76 ∗ h))
Number of away goals = e^((-0.078 + 0.5057 ∗ g + 0.5527 ∗ b))
The other strategy which is termed here as “expert predictions” relies solely on predicted outcomes from betting houses or analytics’ firms like Squawka. They would give us our 4th and final strategy utilised in a similar way where we use the predicted goals scored for each team followed by the Poisson simulation model to give us outcome probabilities.
Poisson simulator model outputting outcome probabilities
Finally, there’s a problem here with having four different strategies! What if each strategy recommends a different bet on a probable outcome (win/draw/loss) for the same match? David discusses this very problem in the closing paragraphs of the chapter. As you would have imagined, one of the easiest arbitration strategy is to take averages from each of the strategies and then put the average expected probabilities to test against the (p > 1/o) test.
3 Self-learning progress
Check out my latest set of updates to my main GitHub repo. I frequently push updates on a weekly basis and the code/resources pushed there should complement the content presented in the weekly blogs.
Dublin Data Science meetup webinar series:
This week most of my self-learning was focused around preparing for, attending and then revisiting notes from the 1st webinar of a series of lectures delivered by Mick Cooney. The theme for these talks is Bayesian modelling and Bayesian inference techniques. The aim we set out as a group in the first introductory session was to understand conceptually and practically the fundamental idea behind Bayesian Inference Engine. Eventually we plan to build a Buy Till You Die (BTYD) model for capturing the behavioral characteristics of non-contractual customers as a series of distributions by the end of the series. The recording of the Workshop 1 can be viewed on YouTube as linked below. If you would like to sign-up for the next workshops as part of this series, you can do that here.
Data: 2 binary variables
A (0/1) - presence of viral infection in the population
B (0/1) - result of an infection detection test
Aim: Getting False Negatives (FNs) as low as possible
Basic theory topics covered: Likelihood, Prevalence, Bayes’ theorem, Poisson distribution, Maximum Likelihood Estimate (MLE)
4 Community briefing
Ted Knutson:
CEO, Co-Founder at StatsBomb is the real pioneer when it comes to soccer analytics and use of sophisticated data-driven techniques to solve tactical and scouting related problems in the game. See below a recent interesting tweet from the StatsBomb Twitter account explaining the term “OBV (On-Ball Value)”. This is something definitely worth digging into in the future.
Transfer roundup:
With the January transfer window only recently closed, all the news and the gossip surrounding the last-minute (somewhat desperate) scramble to sign players is still fresh around in the media. Most of these were signings made by clubs in and around the relegation zone with hopes of improving their performances to be able to stay in the top flight. Most noticeable of which were ~90m expenditure from Newcastle with their new owners gambling to sign some key players again with the hopes to retain their Premier League status for next year.


Quote of the week:
“Wellbeing is achieved through small steps but it’s no small thing” – Zeno.
This technique is described in more detail in Jakobsson,R. & Karlsson, N. 2007. Testing market efficiency in a fixed odds betting market. Working paper No. 12, Department of Statistics, Örebro University.
Best-fit goals-for and goals-against models using Poisson regression as mentioned in notes of Chapter 12 of the book Soccermatics written by David Sumpter.