

Which Centre Backs contribute most to the build-up phase?
Which Centre Backs contribute most to the build-up phase?
We'll be looking at analysing central defenders who are good at building up attacks from the back

It’s been a while since I wrote the last article as I strive to find the right balance between quantity and quality in terms of getting out content published with a regular cadence. With the new season on the horizon, I have decided to focus more on long-term Data Science projects. I’ve made some changes to the format of the usual sections which I’ll call out as we go through them below and as always I’m eager to capture for your feedback of what you think of the new structure!
Speaking of changes, there’s have some exciting news to share - you can now read Three at the Back in the new Substack app for iPhone. Android users still need to wait but can join the waitlist meanwhile as the Android version of the app is launched in the coming weeks.
Which central defenders have been most effective in building up attacks from the back?
Old members will remember this section used to be the Match Analysis section where I wrote about key stats and talking points from Chelsea’s recent matches. This has now been modified to the Blue’s Corner section that will talk about a specific tactical analysis topic.
Blues Corner
From the 2021-2022 Chelsea squad, the players that counted as typical Center Backs would be Antonio Rudiger, Thiago Silva, Andreas Christensen, Trevoh Chalobah and Malang Sarr. Worth noting that we are excluding the likes of Cesar Azpilicueta, Reece James and Ruben Loftus-Cheek who have all featured as part of the back three for the Blues this season but have also been employed at other roles thereby skewing the stats.
Also worth highlighting is the fact that Chelsea have fielded a back 3 in most of these matches and hence the role and influence of a Thiago Silva playing at the center of the back 3 will differ from that of a Rudiger playing predominantly to the left of the back 3 given the inherent difference in their responsibilities.
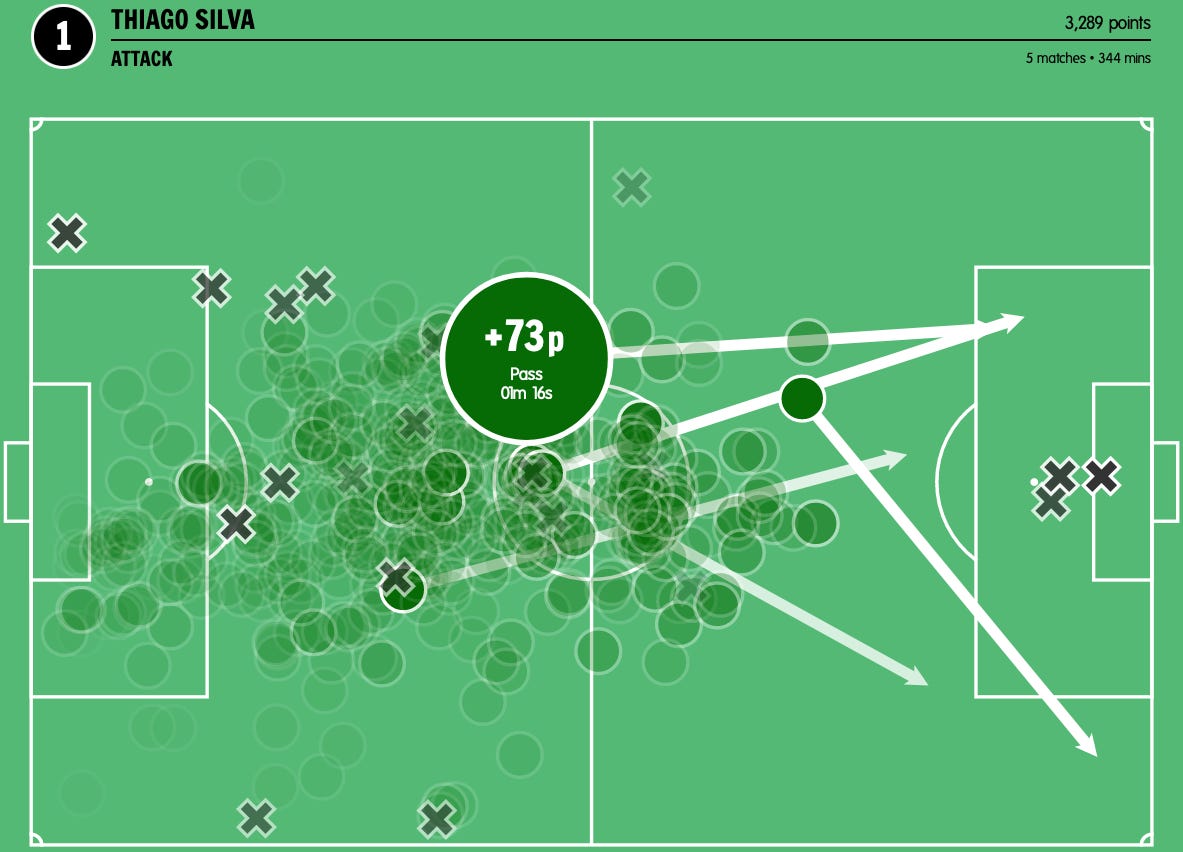
Glossary for reading the above visualization from Twelve Football:
Circles represent all the on-ball actions that primarily include passes and ball carries (dribbles).
White arrows (almost always long) extending from these circles indicate that the actions of high value as they were followed by another attacking action of high value for the team.
Note that shots are not included in the attacking actions as they are classified separately on their own.
First, let’s look at the overall attacking actions of Thiago Silva from this period, who according to Twelve football has the highest aggregate points (3,289 points) for his attacking inputs amongst all Chelsea central defenders. What stands out immediately is his strong presence in the middle third and center of the pitch from where he often relies on long key passes for forwards trying to run in behind. A large cluster of his actions are clustered just behind the halfway line where he feeds progressive balls into the double sixes (the likes of Jorginho, Kovacic, Kante).
It’s his eye for long balls that take out the entire defensive blocks and directness in terms of activating attacks from central half-spaces that make him so dangerous even from so back behind the halfway line. The other thing worth noticing is the handful amount of mistakes he’s committed when trying to perform these attacking actions which is even more significant given the low blocks of the majority teams facing Chelsea.
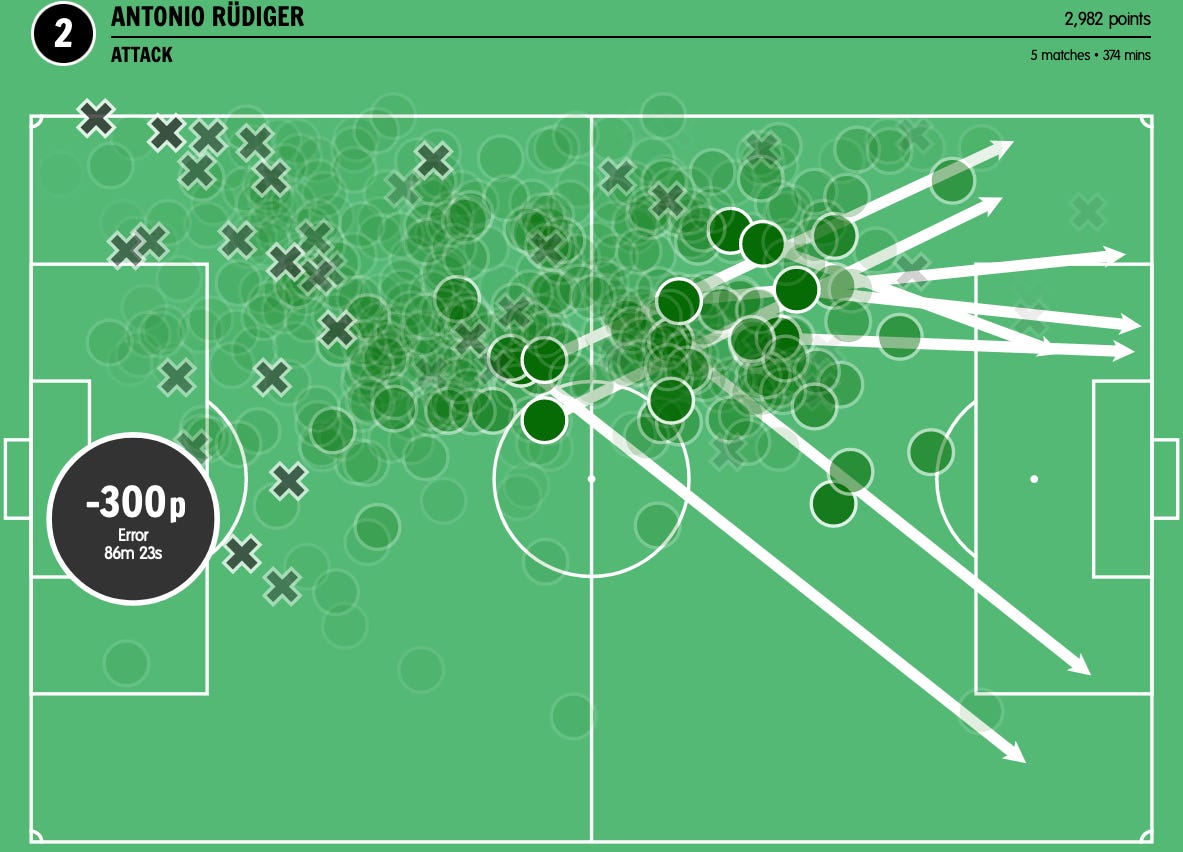
Now let’s compare and contrast the same visual for Antonio Rudiger’s attacking inputs for Chelsea’s matches in the Premier League. Rudiger has 307 points less than Thiago Silva. Playing from the left of the back three he’s predominantly active from the left-hand side with his marauding driving runs into the opposition half and equally effective diagonal switches on the opposite flank that stand out as a feature of his attacking contributions with the ball. He is, on average, more further up the pitch compared to Thiago Silva and his high value attacking actions are thereby leading to more penultimate actions that lead to higher valued chances on goal.
As seen from the image above, the vertical balls put into the left half-space act as perfect candidates from the attackers or wing backs to cut back passes into the box. Whereas his diagonal switch passes are potential triggers for overlaps on the opposite side leading to crossing opportunities for the likes of Hakim Ziyech and Reece James working in tandem. In general, Rudiger’s tenacity to start attacks from the back, again against lower half teams has proven valuable for Chelsea on multiple occasions.
A further deep-dive into the point deficit for Rudiger compared to Silva points out to the higher amount of errors Rudiger has committed on the left of Chelsea’s half trying to carry the ball forward. That could potentially be because of either he’s trying too ambitious passes trying to start quick attacks that eventually get intercepted or oppositions have realised the weak-point in Tuchel’s system where he’s left isolated in this zone and lost for options thereby creating easy pressing opportunities and possession transitions in the wake of forced errors.
Shameless note: In the time that has lapsed since I wrote the initial article draft, Rudiger has already left Chelsea and it would be worth investigating at a later point in the new season if Koulibaly would be a suitable replacement for him in terms of pure marauding prowess!
Premier League’s best Centre Backs in build-up phases
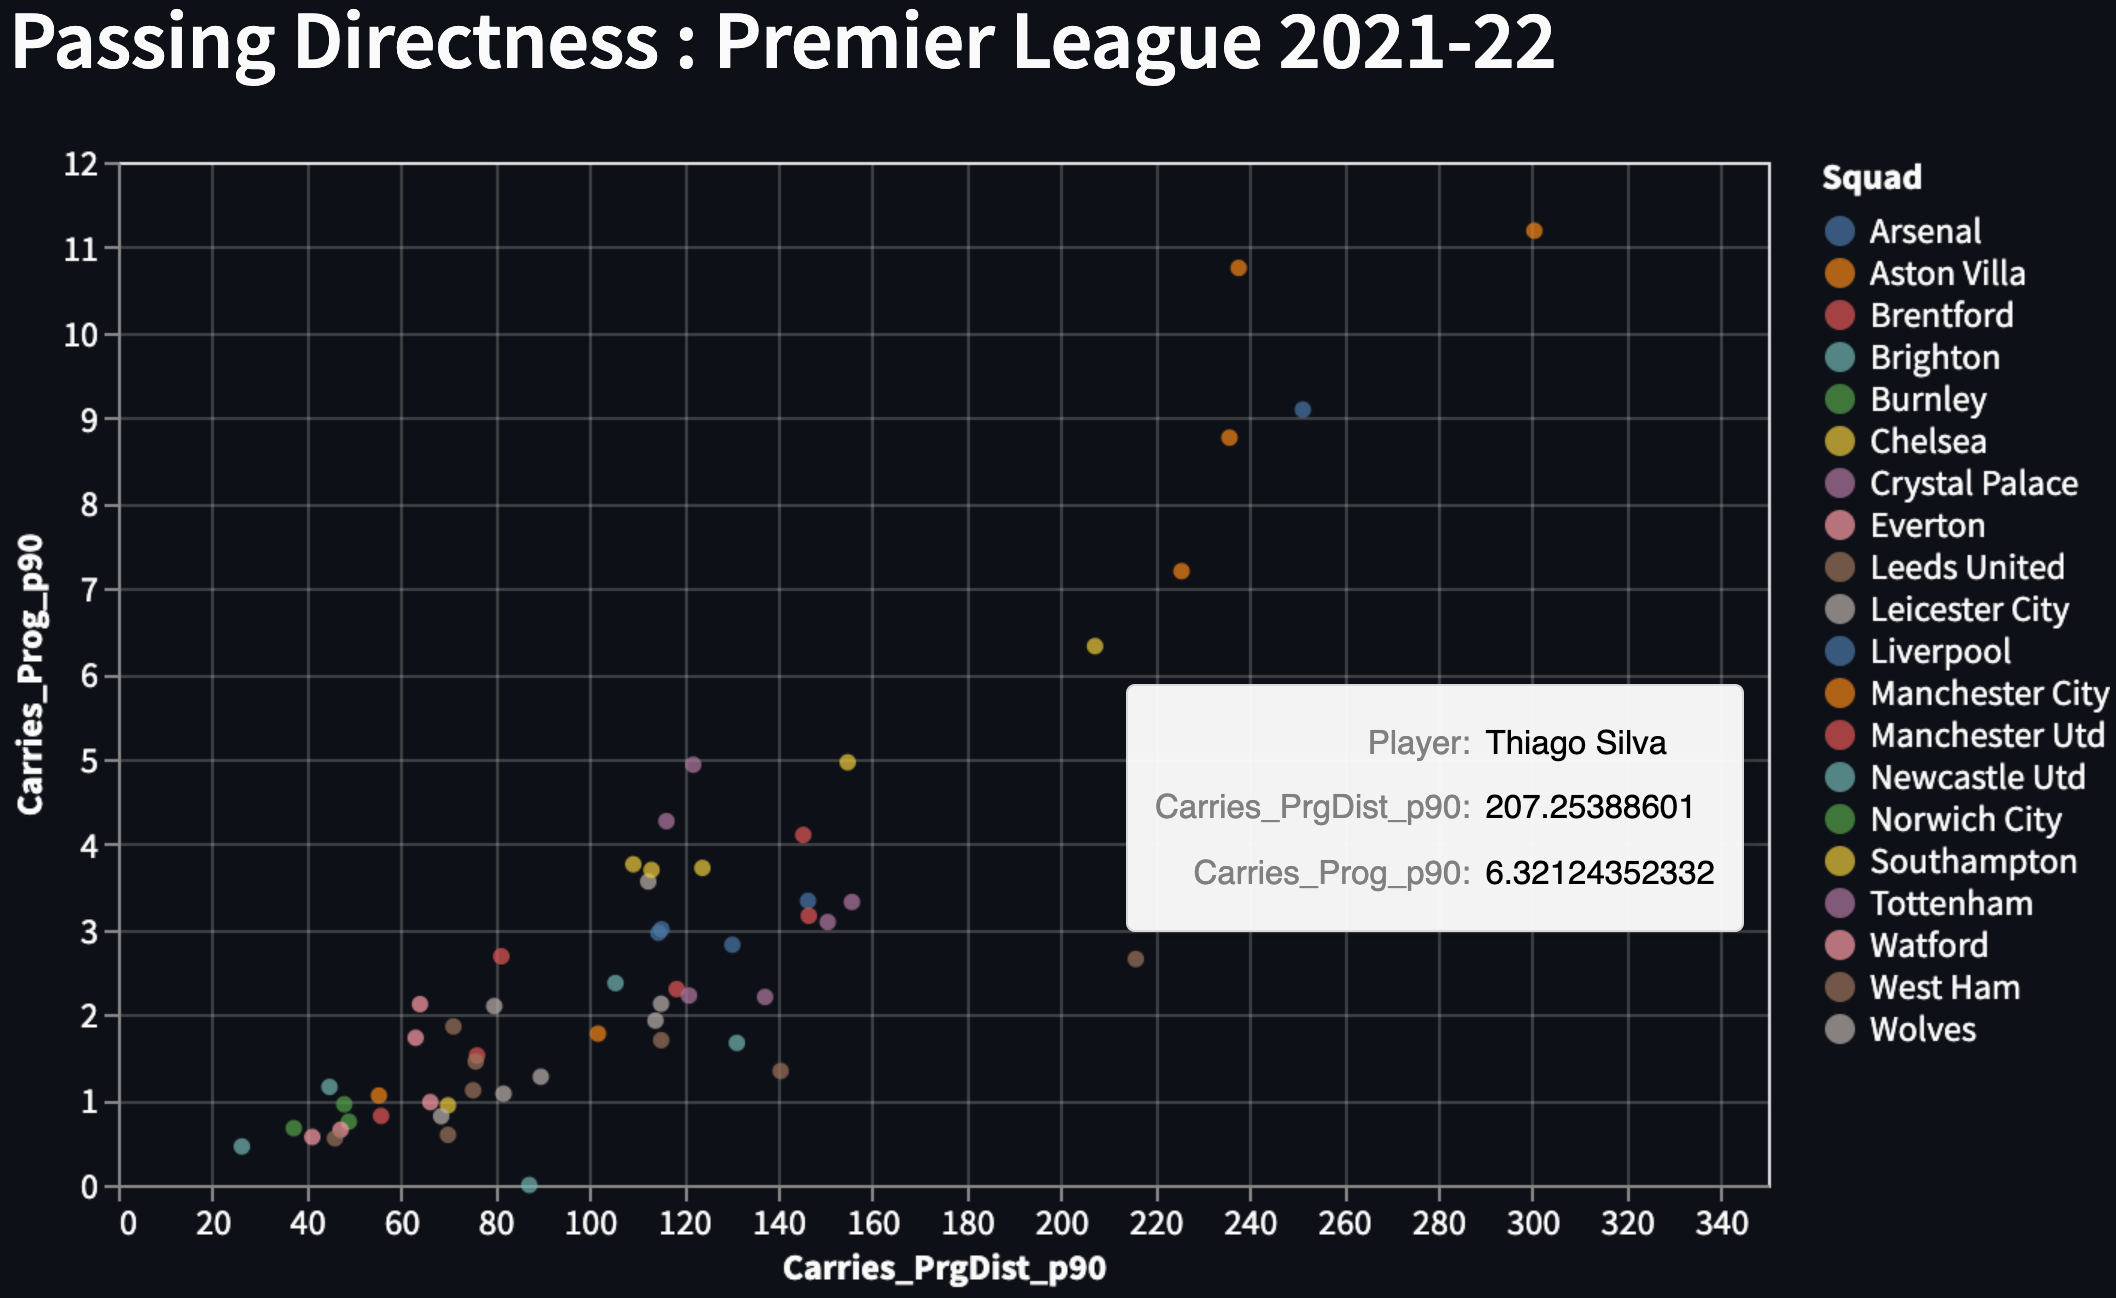
I have built a pretty lean interactive web-app using Streamlit for spotting clusters in the data looking at CB involvement from progressive carries. See the screengrab of the dashboard below and you can find the complete code here.
No surprises when you see Man City players top right - Laporte, Stones, Dias, Aké all fall in this cluster with both high progressive carries (per 90) and high progressive carries’ distance (per 90).
As for other teams’ central defenders coming close to this elite cluster are Liverpool’ Joel Matip and the two Chelsea men reported above in Silva and Rudiger. In contrast Van Dijk, Konaté, Christensen and Chalobah are further down which is interesting to note.
The only defender outside these teams to make near enough to the top of these metrics is Leed’s Diego Llorente. Lastly, looking at the other end of the spectrum - it is very little surprise to see Burnley and Newcastle central defenders having the least progressive carries last season.
Reading Updates
Since my last reading update, I’ve wrapped up reading Soccermatics (by David Sumpter) where we discussed at length, in the previous articles, about use of statistical models for analysing betting odds, player and team performances and more generally getting a better understanding of the beautiful game from a data perspective.
I’ve next picked up The Expected Goals Philosophy (by James Tippett) and next we’ll discuss the two most widely used applications of the xG metric. First of which, as discussed in the book, is within the betting realms where we rely on the expected goals value as a performance metric (team/player) to uncover predictive insights for placing a winning bet.The book discusses how xG emerged from the relatively early (2015) use-cases gathering popularity behind closed doors at gambling syndicates to give them an edge to win hundreds of millions of pounds from the bookmakers. The author discusses a detailed case study of Smartodds, a UK-based betting company, who operate under a crucial presupposition: the league table lies! It gives examples of how “justice tables” were developed to differentiate the quality from the quantity of chances teams created during the course of 90 minutes. The next bead in the thread is tying this concept to “expected points” where we take into consideration the chance of winning/drawing/losing based on xG timelines’ simulations for any given match. All this with the hope to outsmart the bookies and place a profitable bet!
Community Spotlight
This week’s community spotlight highlights some of the great work done by Jesse Davis and his research team at KU Leuven. Jesse is a professor researching AI, machine learning, data mining and sports. Linked below is a simple graphical demonstration of how we can value every single player action in a game similar to what David’s team have managed to do using their points based system we discussed above. Please let me know your thoughts in the comments below about any other methodologies you have come across that look at evaluation player actions.
Quote of the week:
“The Universe is under no obligation to make sense to you.” — Neil deGrasse Tyson